The Standards for Technical Condition Evaluation of Highway Bridges (JTG/T 5230—2026) take effect on 1 November 2026, replacing JTG/T H21—2011. Inspection data should clearly connect components, locations, defect characteristics and historical records.
Field inspection provides the data foundation for condition assessment. More detailed requirements for component coverage, dimensions, traceability and cross-cycle comparison also increase the effort needed to organize, link and review scattered images and manual records.
AIFORAIL connects route planning, image acquisition, AI-assisted detection, professional review and results management through component-level inspection. The aim is locatable, comparable and traceable evidence. This article explains data support, not a substitute for the standard, professional inspection or condition assessment.
1. Three questions inspection data needs to answer
1. Granularity: which component and span contain the defect?
Organizing data from components to spans and the whole bridge requires identifiers for piers, pier caps, girders, bearings and towers, with defects linked to their locations. Component divisions and assessment levels must follow the standard and project requirements; a set of general bridge photos is not a component record.
A consistent component hierarchy reduces ambiguous defect ownership and inconsistent classifications, providing component-based data for subsequent defect-condition scale (EDI) calculations.
2. Interpretation: are defect types and dimensions supported by evidence?
Interpreting durability-related and structural defects requires component type, damage characteristics, dimensions and site context. Store crack widths and damaged areas with source imagery. Professionals determine categories, scales and thresholds under the standard; an AI label does not replace that judgment.
3. History: has the defect changed, and how quickly?
Judging defect, functional and impact conditions requires continuous evidence. Images, dimensions and review status from the same location across inspections help examine crack growth, corrosion and spalling changes, supporting trend review and further investigation.
2. Component-level inspection connects acquisition to assessment data
Use the 3D bridge model and component hierarchy to connect planning, acquisition, detection, review and reporting, giving each defect a component association, source imagery and a traceable record.
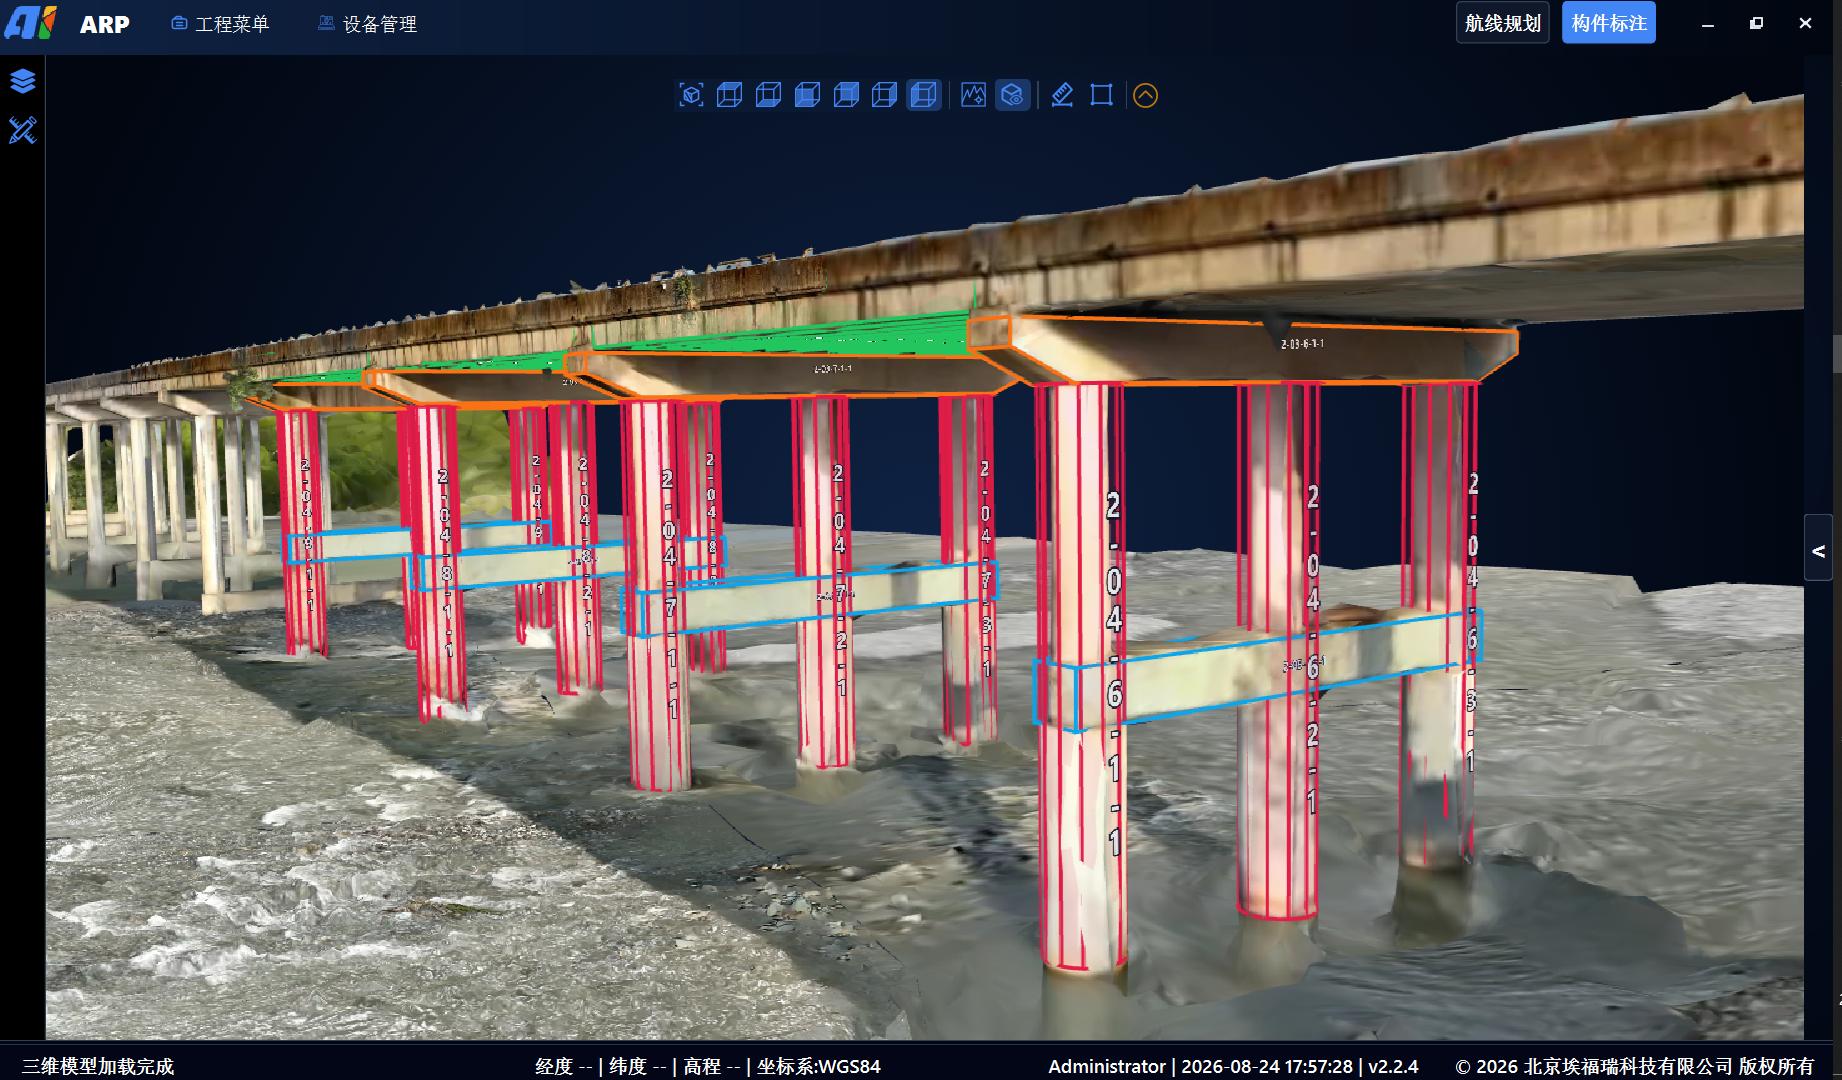
1. Organize targets by bridge type and maintain a record per component
Organize inspection around the following targets according to bridge type and project component definitions. Actual coverage depends on model completeness, accessible space, payload configuration and project validation.
Substructure: piers, pier caps and cross beams.
Girder bridge superstructure: main girders, transverse connections and bearings.
Arch bridge superstructure: main arch, spandrel piers and walls, and spandrel arches.
Combined-system arches: main arch, transverse connections, ties, hangers, columns, cross girders and longitudinal girders.
Cable-stayed bridges: main girders, stay cables, towers and bearings.
Suspension bridges: stiffening girders, hangers and clamps, main cables, towers, main cable saddles and bearings.
Deck and side inspection targets: railings and bridge sides.
ARP annotates target components and generates inspection routes. After acquisition, the platform uses camera position and orientation to associate images and defects with component IDs, creating traceable records for professional assessment.
2. AI-assisted detection of five visible defect types retains dimensional and visual evidence
The platform assists detection of cracks, honeycombing and surface voids, exposed reinforcement, corrosion, and spalling or damage. Professionals review suspected findings against original images and site conditions before confirming types, outlines, dimensions and severity for reports.
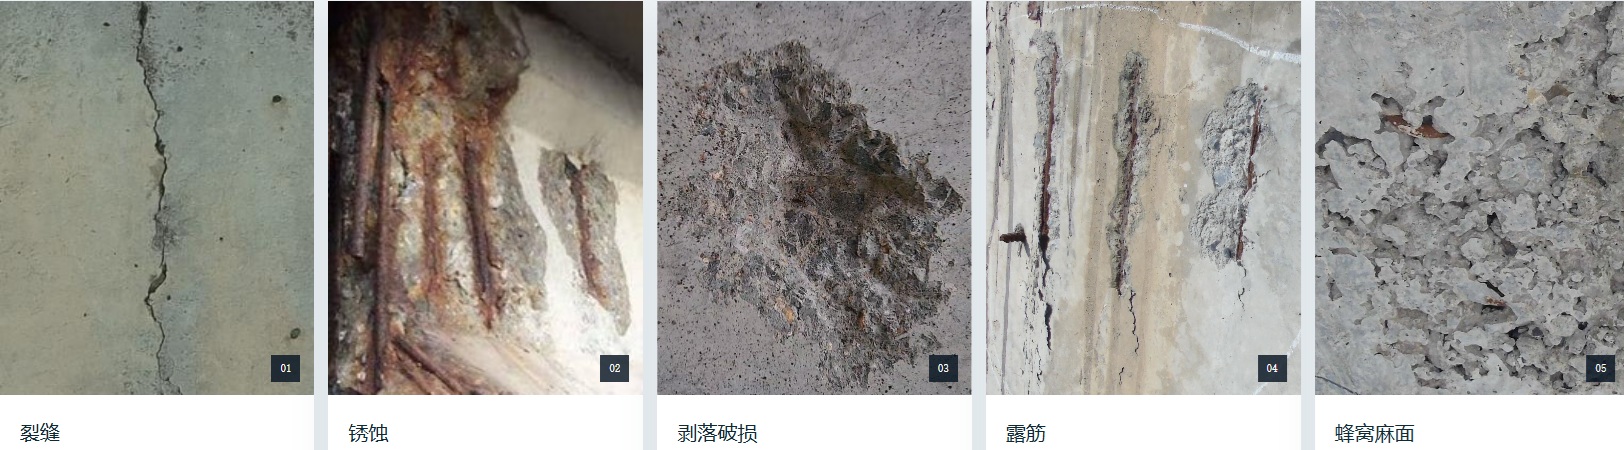
High-resolution crack imagery
The solution uses a 61-megapixel full-frame imaging system capable of identifying 0.1 mm cracks at 4 m under the stated configuration and imaging conditions. Lighting, focus, angle and surface conditions affect detection and width measurement. Dimensions require review; this is not a guarantee of identical accuracy at every site.
Material deterioration and surface damage records
Retain source imagery, locations and characteristics for honeycombing, exposed reinforcement, corrosion and spalling. These support professional interpretation of durability and structural defects. Professionals determine scales such as ESDI and EDDI under applicable provisions; automated detection does not establish compliance or safety.
3. Historical comparison supports change verification and trend review
Reusing standardized routes improves comparability of camera positions, angles and distances. The platform displays historical and current same-location photos, defect dimensions and review records side by side to examine crack growth, corrosion and spalling changes.
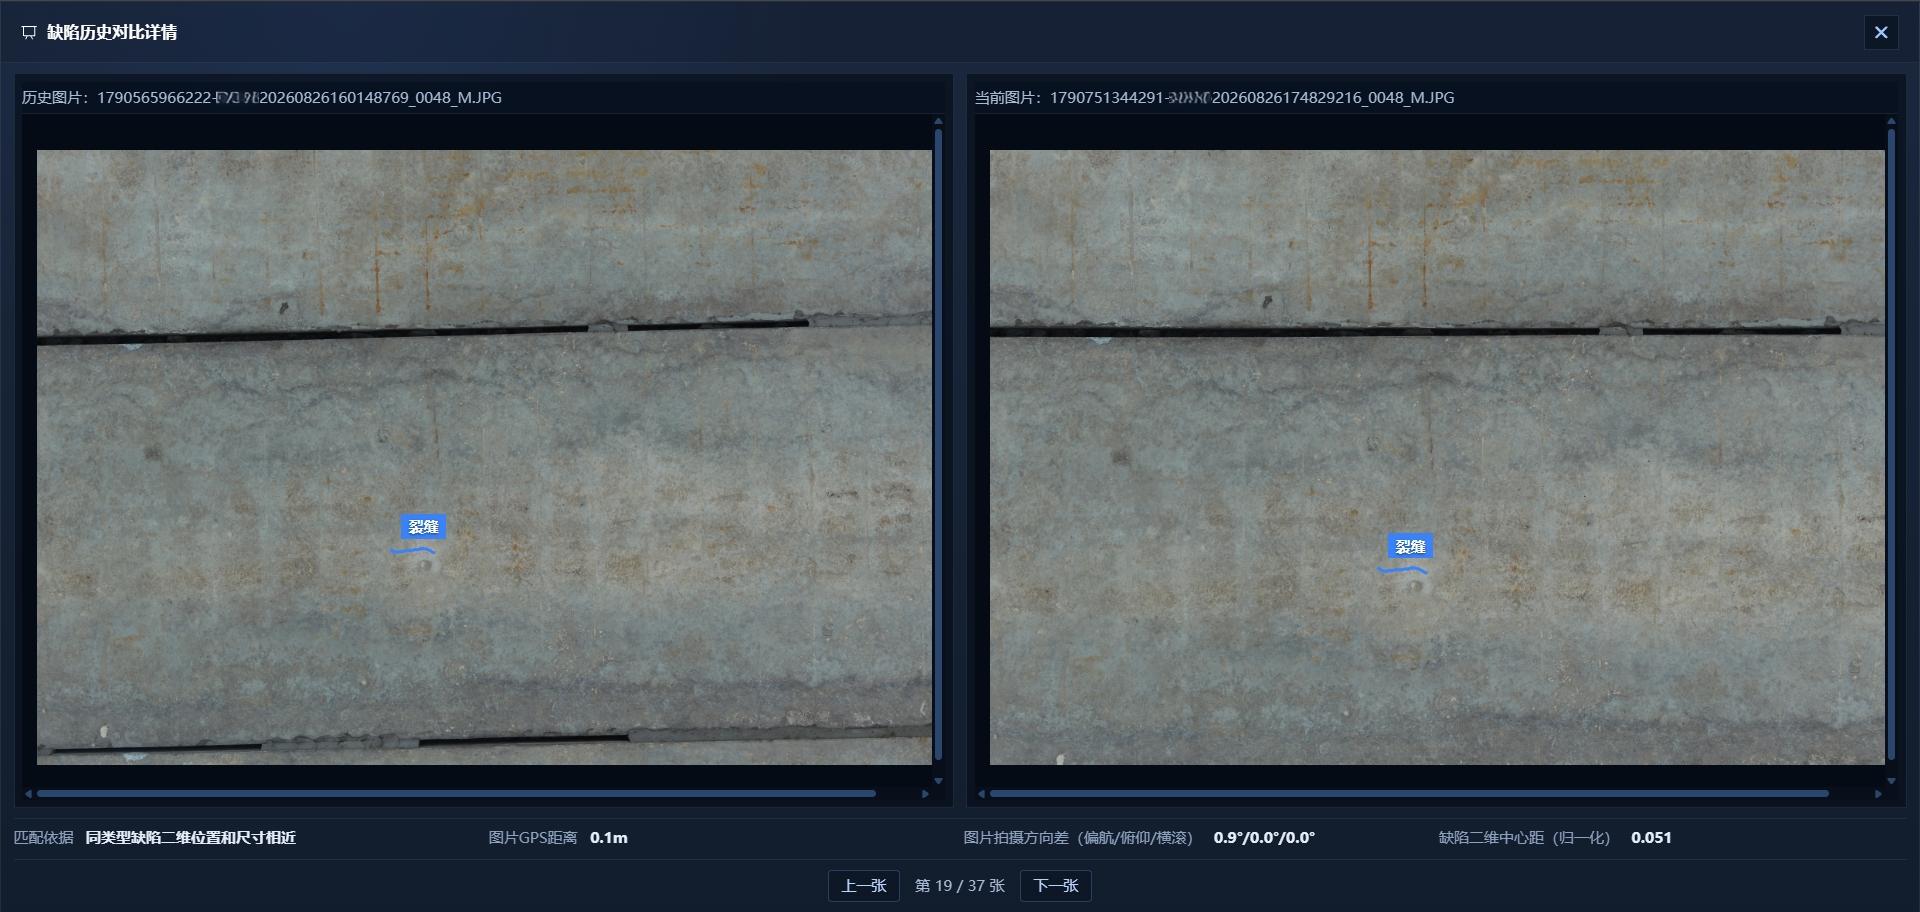
Continuous records provide evidence for defect growth analysis, impact-condition scale (EAI) assessment and decisions on targeted investigations. Trend analysis depends on data quality and comparability and does not replace structural safety assessment.
4. A digital workflow from planning to reporting
Planning: ARP imports the 3D bridge model, generates component-based routes, checks conflicts and reviews simulated flights, providing reusable acquisition plans.
Execution: INES connects RTK and LiDAR SLAM, while AGS monitors routes and flight status. With project-specific integration, positioning accuracy of 5–10 cm can be achieved under bridges without satellite signals, supporting autonomous acquisition and reducing personnel exposure at height or over water.
Review: the platform organizes imagery, AI-assisted screening and component associations. Professionals confirm findings using original and historical records, reducing manual photo organization.
Output: compile reviewed findings by component and defect type, including distributions, component details and visual evidence. Templates can be configured for project records; formal assessment conclusions are produced by qualified professionals.
3. Traceable data supports targeted maintenance
Reduce organization and repeated work
Standardized routes, autonomous acquisition, AI-assisted screening and component association can reduce photo organization and review preparation. Actual efficiency gains depend on bridge type, site conditions, data volume and team processes.
Make assessment evidence clearer
Component associations, imagery, dimensions and review status let users trace reported defects back to components and source photos, reducing disconnected records.
Provide continuous records for differentiated maintenance
Comparable component records help maintenance teams identify locations needing follow-up and continued attention, informing priorities and actions after professional assessment.
Prepare inspection data for the updated standard
Ahead of JTG/T 5230—2026 implementation, AIFORAIL supports continuous bridge records through component-based planning, image acquisition and results management. Contact us to discuss integration based on bridge type, component hierarchy and project delivery requirements.