Limited possession windows
Short service breaks favour sampled sections, leaving weeks between observations.
 Contact Us ↗
STS combines onboard laser scans with TIDS positioning to detect clearance intrusions, identify tunnel-wall defects and build a 3D record during service. It produces records in 5 m segments without a dedicated inspection vehicle.
Short service breaks favour sampled sections, leaving weeks between observations.
Small changes in intrusions, seepage, cracks and spalling can escape visual inspection.
Without mileage, coordinates and raw point clouds, verification often requires another visit.
| Dimension | Manual inspection | STS |
|---|---|---|
| Frequency | Weekly to monthly section sampling | Per-run scanning during daily operation |
| Defect location | Manually estimated location | Mileage and 3D coordinates; centimetre-scale mileage positioning requires project validation |
| Retained evidence | Separate photos and notes | Continuous point-cloud records for review and comparison |
| Track possession | Requires a service break | Runs with service trains without a separate survey possession |
Onboard equipment comprises the STS host, laser scanner, time-alignment unit and DPP status panel for processing and storage, profile capture, aligned records and health indication.
Supplies position, speed and direction over Ethernet with link-health monitoring. Positioning and timing for trains without TIDS require separate confirmation.
Overview, defect statistics, trends, archives and downloads.
Align 200 Hz tunnel profiles with TIDS position and speed by timestamp, split into 5 m segments and evaluate each to create a record with mileage and coordinates.
Each scan captures one profile; train movement covers the tunnel length. Repeated runs increase coverage density, and lower speeds produce denser point clouds. This allows each run to scan the full line.
Choose roof or coupler mounting for the vehicle and clearance conditions. GB 50517 and EN 50155 inform the design; project documentation determines conformity.
Scan the track area in 5 m segments, compare the point cloud with clearance models and trigger an alert on intrusion.
Structural clearance, kinematic envelope and a user-defined clearance envelope.
Identify track curvature and adjust scan parameters to maintain comparable judgement accuracy on straight and curved sections.
Intrusion depth and 3D coordinates; normal regions are black and intrusions highlighted red.
Timestamp, triggered envelope type, line section, precise mileage, direction, track Link ID, intrusion coordinates and raw PCD file.
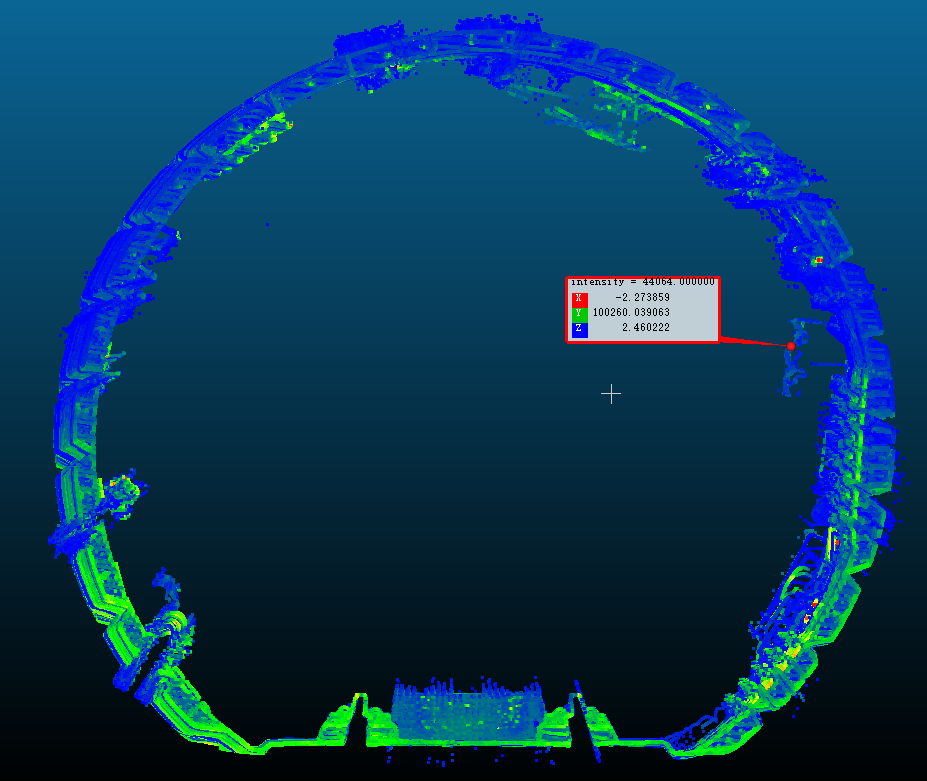
The system records clearance decisions and evidence. The operator determines object nature and action under site procedures.
| Defect | Detection scope | Output |
|---|---|---|
| Seepage | Seepage, wet patches and water streaks | Mileage and 3D coordinates for tracking changes in extent |
| Cracks | Continuous and network cracking | Direction, length, width and density |
| Concrete spalling | Broad spalling, fallen pieces and rockfall risk locations | Defect report and falling-piece risk indication |
Enable the three tasks independently by maintenance priorities. Store each defect type in a separate directory; alerts retain time, type, station section, mileage, geographic coordinates and PCD evidence.
Width detection responds strongly to surface-wet cracks but has limited performance on dry cracks. Alerts locate cracks; specialist assessment is needed for depth and structural significance.
Export raw points as standard PCD, align them with CSV mileage logs and build a full-line 3D record using straightened modelling. Each PCD holds accumulated points for one TIDS interval to preserve sequence.
| Use | Description |
|---|---|
| Deformation monitoring | Compare the same section across periods to observe deformation trends |
| Lifecycle records | Traceable records from handover through maintenance |
| Defect visualisation | Show spatial distribution and development of cracking and leakage |
| Decision support | Inform maintenance plans, spares planning and safety assessment |
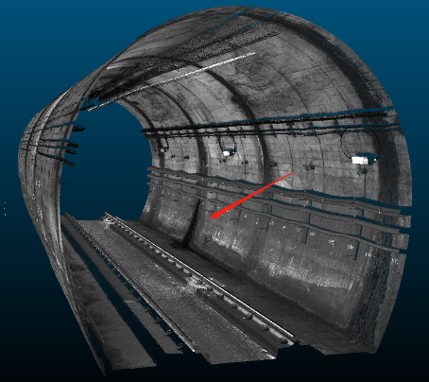
Deformation comparison accuracy measures relative change at one location across periods. Minimum detectable target size, listed under performance, is a separate measure and must not be substituted for it.
| Speed | Straight track | Curve (R=300 m) |
|---|---|---|
| 20 km/h | ≥83×47 mm | ≥84×47 mm |
| 40 km/h | ≥167×47 mm | ≥168×47 mm |
| 60 km/h | ≥250×47 mm | ≥252×47 mm |
| 80 km/h | ≥333×47 mm | ≥336×47 mm |
| Speed | Minimum continuous-crack region |
|---|---|
| 20 km/h | ≥165×20 mm |
| 40 km/h | ≥335×20 mm |
| 60 km/h | ≥500×20 mm |
| 80 km/h | ≥667×20 mm |
Targets must span ≥3 radial frames and ≥5 points per frame. Validate reflective and absorbent surfaces onsite. These test figures depend on speed, material, mounting angle and tunnel conditions.
A dedicated cloud server is isolated from other product services, supports 24-hour access and allows expansion.
Overview, statistics and raw-data downloads.
| Function | Description |
|---|---|
| Multidimensional search | Filter by type, time and location; inspect all alarm fields and download linked PCD |
| Historical retention | Retain approximately three years of intrusion, seepage, crack and spalling logs |
| Dual-window comparison | Compare defect distributions and counts across periods and sections side by side |
| Batch download | Download five raw PCD files per batch; buffer offline and resume transfers; export xlsx, csv and pcd |
Monthly top-five sections by defect share, bar charts comparing counts by date and section, and a 30-day trend overlaying total events with intrusion growth.
Historical results and logs remain available in the cloud while the train is offline. Missing results upload automatically when it reconnects.
Last updated